The Kerala’s favourite portal Keralaonline was revamped and relaunched with futuristic online services by Saturn SPL on October 2008. The whole news portal was built on top of the popular blogging and content managment system WordPress. With about 30K hits per day, and 8000 entries across 100+ categories and video clips, the site started to slow down by about the end of March. This was the time when our team lead stumbled upon the mysql profiler, and thought about the Open PHP MyProfiler. This gave a spark, and the Open PHP MyProfiler, was built originally to run sql profiling on keralaonline.com.
We ran the profiler on the live system on March 24th for the first time.
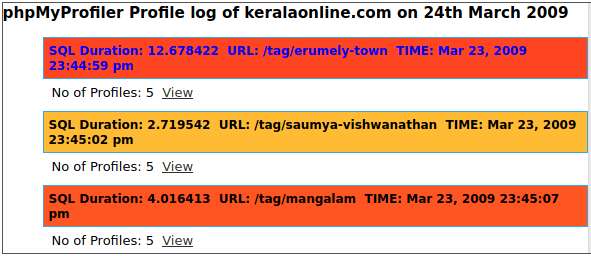
Though most of the ‘/tag’ urls are having only 5 queries to the database, it takes too much time to return, by opening the view you can see that the whole time was spent on the first update posts query. What the heck was this, this should not be here. A thorough and detailed check revealed that on an intermediate update of the theme, the hit count updates from single posts, where pushed some how into the header, and the post hit counts were all mixed up. That was not the critical crieteria, and hence we just moved the hit counts from the header and put into the single.php down at the bottom, even after the footer portion and a flush() statement. Some more tunnings were done like for instance the blog_info function calls were stripped off from the header where the menu was being built, and instead all static urls were fed in. The mysql server variables for query caching, table cache, packet size and temp table size were tunned with the help of mysqltuner. After all these, a second profiling was done on March 26th.
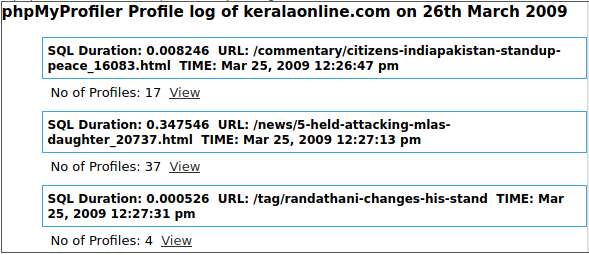
Note the differences in ‘/tag’ url timings and the number of queries. Just by opening the view link corresponding to each url, the distribution of the total time across each query can be seen. There was further optimizations since this was done and after the whole lot, since we had eaccelerator on this server, I thought about an object cache and stumbled up on the Neosmart Object Cache. The results were mindboggling. Also while at this, we simply pulled out the yaarp, which was a real bloat. I would not curse the developers, since it was a clean and really great method of getting the exactly related posts, for a heavily hit portal, it was an over kill.
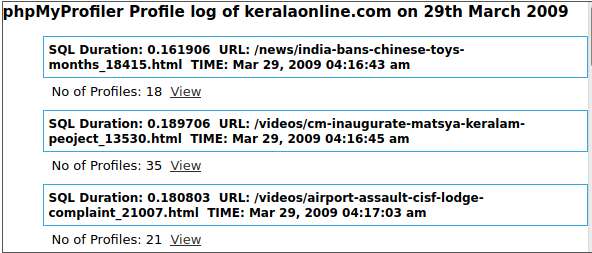
The number of queries on individual pages dropped drastically and the increase in performance was noticed by some employees of the promoters, who personally called up our office and expressed the fact. Out come in a nutshell was that pages which were taking 13 to 14 seconds to be built or rendered at the sql side, was brought down to a few milli seconds.